
Join us for the HCQIS Human-Centered Design Community of Practice on September 25!
Many people are confused or uncertain about the term design. With so many different design types—graphic, user experience, interaction, user interface, animation, industrial, architecture, and the list goes on—it is no wonder that misunderstandings persist. To further complicate matters, good design is often a combination of different types of design.
Join the Human-Centered Design Community of Practice on Friday, September 25, to explore the challenges of Working at the Intersection of Graphic Design and Human-Centered Design. Sr. Design Strategist Brian Flaherty will delve into:
- Graphic design and its place with human-centered design
- Design as a craft and way of thinking
- The future of design
The program will include a presentation, small group activities, and a group Q&A.
Register now to join the discussion and to collaborate with a community of professionals. Attend via Zoom.


My first thoughts of brainstorming conjure an image of folks sitting around a restaurant table with pen in hand scribbling ideas on a cocktail napkin. The point being ideas are best conceived in a relaxed environment where all parties and suggestions are weighted equally. As more organizations establish space to spark creativity and problem solve, I was eager to attend Brainstorming Better hosted by the Human-Centered Design (HCD) Community of Practice to learn how this method could be conveyed to a business environment without stifling spontaneity.
The guest speaker was Natalie W. Nixon, a creativity strategist and president of Figure 8 Thinking. Natalie’s background is impressive, leading companies such as Comcast, Bloomberg, Vanguard, and Living Cities in applying creativity and foresight for transformative business results. With a background in anthropology and fashion, she brings an interesting perspective toward helping a team or organization to see, interpret, and innovate differently.
My registration confirmation email asked that all participants bring three blank sheets of paper and a Sharpie, pen, or pencil for use in a virtual brainstorming exercise. Being an introvert, the mention of interacting with the group was a trigger for me to proceed with caution. But my concerns were unfounded, as Natalie put me at ease from the start. She is a dynamic speaker, and her enthusiasm of the topic and incorporation of exercises worked to reinforce what she presented, and it was fun! To paraphrase Natalie, “play is actually very important; when we are having fun, lesson’s stick.”
Not only was the hour-long event fun, it was also informative. Brainstorming is a form of play that provides a method of discovery. As with all play, there are rules that provide a framework to get you started. It starts with a problem to define or a need to find, but then what? How do you proceed? Natalie offered several rules to brainstorming—the first to use time as a constraint for creativity, and then provided hands-on exercises to demonstrate how to quietstorm, questionstorm, and use the SCAMPER method.
Our first exercise focused on quietstorming. With a 90-second time limit, we were asked to list 20 uses of a paperclip—any size, any number. Natalie emphasized the value of quantity over quality, by suggesting we think as our 8-year-old self, not as our current adult self as we create our list. We weren’t to judge the feasibility of the use, but simply to suggest it. My list included a slingshot, a shovel, a hair barrette, a bookmark, a game piece, a spoon. It was interesting to hear the similarities as well as differences of ideas. The lists provided a variety of uses from which to choose, which is the main point—quantity over quality with no judgment. Quietstorming has three components: thinking quietly to yourself, pairing off with the person next to you if in a workshop or group scenario, and then sharing with the larger group, or in simpler terms: think, pair, share.
Our second exercise focused on questionstorming. Over the years, I have heard there is no such thing as a stupid question, but I liked Natalie’s take on the phrase based on what she learned from Warren Berger, “asking questions is a way of thinking.” It puts a more positive spin on the desire to learn or be more curious. Through his research to understand why innovative companies were successful, Berger developed three questions as a method toward defining a problem or finding a need. These questions ask why, what if, and how. To show us the process, Natalie walked us through these questions using a pen. Starting with why—why is the pen plastic; why does the pen have a cap; why is the pen round. Moving on to what if—what if it was made of wood; what if it was a different shape; what if it had multiple colors. And finally, converging these questions into how— how might we make it multiple colors; how might we change the shape; how might we make it out of wood.
To make the exercise CMS-centric, we were given 30 seconds for each question as it relates to customer experience at CMS. I thought this was a more difficult task but was able to write several questions for each. It was interesting when several participants shared their questions, to learn how similar they were.
The final exercise was the addition of another constraint defined by the acronym SCAMPER, which represents seven different actions to generate new ideas through the ebb and flow of divergence and convergence. The seven actions are Substitute, Combine, Adapt, Modify, Put to other use, Eliminate, and Reverse. Using one of our “how” questions from the previous exercise, we were first given an action word (mine was eliminate), and then we were divided into smaller groups. Within the group, we presented our “how” question and then indicated how we would apply the action word. I went from “How can we interact more directly with customers?” to “Create interactive chat on the web to eliminate the delay in response.”
This hour provided great insight on techniques for better brainstorming, whether with a group or individually. I learned that it is not the physical space that sparks creativity and problem solving, but the rules that provide a framework allowing you to play and discover new ideas. If you were unable to attend the event, a recording is available on the HCD CoP Confluence page.
Article by Susan Pagan . Originally published in PM3 Connect on July 7, 2020.

Accessibility means that people with a broad range of abilities, including visual, motor, auditory, speech, or cognitive disabilities, can use websites and other digital services.
Accessibility is essential to a successful website. The Centers for Disease Control and Prevention estimates that one in four U.S. adults – 61 million Americans – have a disability. And if that number were not compelling enough, accessibility is the law. For more information, see Section 508.gov.
So how does a team create accessible digital experiences?
On Friday, July 31 at 1 PM, the HCD Community of Practice will welcome iQIES team members Htet Htet Aung, UX Designer, and Sandra Clark, Front-end Developer, to explore:
- Fundamentals of accessibility and UX
- Whom are we trying to help, and why does it matter?
- Incorporating accessibility into the design process
CMS Program Analyst/COR/Section 508 Clearance Officer Brinda Large will join for a panel discussion and question and answer segment with the HCD Community of Practice.
Brinda is ISG’s 508 Compliance subject matter expert and is involved with accessibility from solicitation to testing to document remediation. Htet Htet specializes in medical applications and accessibility. Her interest in accessibility advocacy began as a researcher for mobile-based text input for people with cerebral palsy and Parkinson’s at Carnegie Mellon University. Sandra has had an abiding interest in accessibility for over 15 years. She has spoken at several programming conferences about the how and why of accessibility.
Register today to join the discussion and to collaborate with a community of professionals. Attend via Zoom.
Service design is the process of understanding and refining an organization’s people, processes, systems, and policies to improve both the employee experience and, directly and indirectly, the customer’s experience. The Human-Centered Design (HCD) Center of Excellence (CoE) has articulated a simple 3 step approach to service design including:
Personas -> Journey Maps -> Service Blueprints
In Part 1 we defined customer Personas and in Part 2, stressed that a Journey Map reflects a specific Persona’s experience with an organization. To close out this series on service design, we will discuss what we do with this gained empathy for the customer experience.
Service Blueprinting: Visualizing the Employee Experience
Think back to the pre-COVID days when you could get a reservation at a nice restaurant. Chances are, many “cooks” contributed to your dining experience. From the line cook and sous chef to the executive chef and baker, all of these functions contributed to your culinary experience, for better or for worse.
Yet if we took the role of food critic, our review would reflect our experience in the dining area, not what may or may not have happened in the kitchen. While a journey map reflects the customer view of the “dining room” experience (i.e., what the customer sees), a service blueprint is an artifact that visually describes the “kitchen” - how the people, processes, and physical (or digital) resources ultimately supports a specific journey.

Photo by Fabrizio Magoni on Unsplash
Think of service blueprints as the flip side of the same coin, yet representing the employee experience. So what is this artifact and what do we do with it? A service blueprint provides details about how employees support a specific customer journey. So, what types of information should a good service blueprint include?

Nielsen Norman Group
A service blueprint recipe of basic ingredients should include:
- Evidence – This represents the physical and digital touchpoints, or focal points for interaction. Following the restaurant scenario, evidence could be a billboard or menu or emailed coupon.
- Customer Actions – A slimmed down representation of the steps, choices, activities, and other actions a customer takes with an organization to reach a particular goal.
- Frontstage Actions (what the customer sees) – A customer does not just act – they interact with you, so this layer should reflect what the customer sees during touchpoints along the journey. Who do they communicate with? What tools do they use to transact with the organization? What is the trigger? What happens next? How is the transaction completed?
- Backstage Actions (unseen steps and activities that support Frontstage) – This is the most important information in this artifact, reflecting the actions taken by employees unseen by the customer (e.g., cook in the kitchen) or a frontstage employee who does something unseen by the customer (e.g., waiter entering order into a touchscreen system)
- Support Processes – This reflects the steps that must take place internally in order to fulfill the customer journey. This typically reflects actions from employees who do not regularly interact with customers.
Service blueprints must be created by pulling frontstage and backstage inputs from real employee accounts and validated through internal research. This research and validation will likely need to traverse functional groups across an organization. Some key benefits of this work and the resulting artifact(s) include:
- Uncover systemic organizational weaknesses and inefficiencies
- Identify opportunities for optimization
- Assign areas of ownership for the experience
- Flatten silos by sharing responsibility for the customer experience
- Helps organizations make decisions that matter
Learn more
This series’ focus on Personas, Journey Maps, and Service Blueprints is meant to reiterate one of the tenants of human-centered design: customer empathy leads to insights that can guide employees to better fulfill their organizational mission. HCQIS is committed to helping our team members learn more about HCD to help us better support customers. Here are two ways you can learn more today:

![]()
ROB FAY
Rob currently leads the CCSQ Human-Centered Design Center of Excellence (HCD CoE). The HCD CoE is an organization that impacts the way the CCSQ delivers policy, products and services to its customers. Through the provision of education, support and resources, he promotes the continued implementation and usage of HCD best practices and seeks to fulfill the charge of OMB Circular A-11 Section 280 (i.e., “Managing Customer Experience and Service Delivery”). For over 20 years Rob has focused on making products and services delightful and easy to use by leading research and design initiatives at government agencies like CMS, NIH, and USPTO and commercial organizations including Blackboard and Allegis Group. Rob holds a Master of Information Management and a Master of Science in Marriage & Family Therapy from the University of Maryland, College Park.
Service design is the process of understanding and refining an organization’s people, processes, systems, and policies to improve both the employee experience and, directly and indirectly, the customer’s experience. The Human-Centered Design (HCD) Center of Excellence (CoE) has articulated a simple 3 step approach to service design including: Personas -> Journey Maps -> Service Blueprints In Part 1 we covered the topic of Personas and the important practice of identifying, defining, and gaining empathy for the specific customers of your products and/or services. Today, in Part 2, we explore the second step of service design, which focuses on customer Journey Mapping.
Journey Mapping: The Voice of the Customer
Once upon a time, I fathered a wonderful girl who, at this time of writing, is four years old. My daughter’s favorite Disney movie is Cinderella. If we fast-forward to the ending of the story, Prince Charming wants to marry the unidentified maiden he met at the Grand Ball. Unfortunately, she leaves in haste before he learns her name. His only clue to her identity is that she leaves behind one glass slipper. The next day, the King sets the Duke on a mission to have the slipper fitted on every girl in the Kingdom. And of course, when the Duke places it on Cinderella’s foot, it fits perfectly!

Cinderella (1950), a Walt Disney Production
Too often organizations focus on creating great products and services in a one-size-fits-all approach. That is, we take the time to create a great product (e.g., glass slipper) but we do not thoughtfully consider the unique customer needs and goals – will it fit? We often, like the Duke, try to forcefully stuff oversized feet into a dainty glass slipper. We seek to solve the problem rather than to first understand or reframe the problem.
You will create innovative solutions if you first develop a deep understanding of your target customers (see Part 1 – Personas). Note that I use the plural “customers” because your solution should never be one-size fits all. In fact, one way to gain empathy for your customers is by developing a customer journey map.

Nielsen Norman Group
A customer journey map is a visual artifact representing the customer’s perspective of what their experience is like with you, the organization. This does not reflect the organization’s perspective. Rather, it is what I call an “empathy artifact” – a tool to reflect the voice of the customer. Empathy artifacts lead to businesses solving the right problem the right way, significantly increasing their return on investment for upfront costs.
Here are the basic ingredients of a good journey map:
1. Context – Set the context by addressing:
- Persona – Which type of customer is represented? Be as specific as possible.
- Time – Does the visual represent one customer interaction with the organization or does it reflect all touchpoints over an extended period of time?
- Goals – Why does this customer want to engage with your organization?
2. Journey – The core content of this artifact should reflect a persona’s:
- Milestones – what are key chronological events that represent a persona’s interaction with the organization?
- Doing, thinking, feeling – What activities or motivations does this persona have when interacting with the business? Are these interactions positive or negative?
- Touchpoints – How does this persona interact with the organization? Email? Phone? In-person? Desktop? Mobile?
3. Opportunity – Organizations can leverage this artifact for advantage by identifying:
- Pain Points – Where in the journey are there problem spots, as identified by the customer?
- Opportunities – Where can businesses find areas of the journey to improve, or even create new products or services that can address opportunities highlighted by their customer?
- Ownership - Your customer does not care about your org chart, so their experience may traverse multiple parts of your organization. Use this artifact with problem solvers and leadership to identify areas of focus and people willing to take on the challenge.
Although we haven’t addressed how a journey map is constructed, it should go without saying that if you’ve created it without any customer research, input, and validation activities, you’ve done it wrong! A good journey map should act as the customer voice when the organization makes decisions that will impact its customers. Think of this artifact as your “Fairy Godmother” that can help usher in a fairy-tale ending for your organization.
Learn more
In Part 3, we will conclude the series by defining and discussing the value of service blueprints. HCQIS is committed to helping our team members learn more about HCD to help us better support customers. Here are two ways you can learn more today:
![]()
ROB FAY
Rob currently leads the CCSQ Human-Centered Design Center of Excellence (HCD CoE). The HCD CoE is an organization that impacts the way the CCSQ delivers policy, products and services to its customers. Through the provision of education, support and resources, he promotes the continued implementation and usage of HCD best practices and seeks to fulfill the charge of OMB Circular A-11 Section 280 (i.e., “Managing Customer Experience and Service Delivery”). For over 20 years Rob has focused on making products and services delightful and easy to use by leading research and design initiatives at government agencies like CMS, NIH, and USPTO and commercial organizations including Blackboard and Allegis Group. Rob holds a Master of Information Management and a Master of Science in Marriage & Family Therapy from the University of Maryland, College Park.

A Summary of the Human-Centered Design Community of Practice’s April Program
How are product analytics used to quantify behavior and impact along the customer journey? This question was the topic of discussion during the Human-Centered Design (HCD) Center of Excellence’s Community of Practice program on April 24. The program began with a presentation by Noble Ackerson, a Senior Product Manager at Ventera and a Senior Product Owner on the iQIES program, followed by a discussion facilitated by Stephanie Ray, the ISG strategy owner for the HCD Center of Excellence, from CMS.
The presentation was divided into three sections—Definitions, Lean Analytics, and Lessons Learned—as it relates to the iQIES program and began with a definition of analytics and why they are important.
Remote facilitating and presenting can feel especially daunting. Most of the challenges of in-person workshop facilitation and presentation are simply exacerbated by remote scenarios; however the right tool selection and additional planning can mitigate many of these challenges.
Tips for Remote Facilitating and Presenting
- Turn on your camera: Showing your face can help establish rapport and trust with participants and help them see you as a real person, not just a voice. This sense of connection can be critical when you are seeking buy-in or attempting to guide a group to consensus about UX or design decisions.
- Enable connection: Plan for additional time in the agenda for relationship building with a digital icebreaker, especially if participants do not know each other. For virtual UX workshops, help participants engage with each other throughout the session by encouraging everyone to respond to each other using people’s names and making use of breakout groups, polling, and chat.
- Create ground rules: At the beginning of the session, share ground rules that will help mitigate the inevitable communication challenges of digital meetings. These rules might include asking participants to agree to state their names before speaking, not speak over anyone, and avoid multitasking.
- Assign homework: Provide participants short homework assignments that allow them to practice using the technology before the session. For example, if you plan on using a virtual whiteboard application during a design workshop, you could ask participants to create an artifact to introduce themselves using that same application before the workshop, and have them share it as an icebreaker at the beginning of the workshop.
- Adapt the structure: Resist the urge to take an existing workshop structure presentation format and simply reuse it for a remote session. Think thoughtfully about how to transition activities, slides, and content to a virtual format. This includes modifying workshop agendas and presentation timelines to accommodate for technology inconveniences and additional activities that allow participants to connect and engage.
Tools for Remote Facilitating and Presenting
- Presenting UX work: Zoom, GoToMeeting, and Google Hangouts Meet are a few of the many reliable video-conferencing platforms. When selecting a platform, consider which, if any, specific features you’ll need (e.g., breakout rooms, autorecord, gallery view), and be mindful of any limitations of free versions. (For example, the free version of Zoom caps meetings with more than two attendees at 40 minutes—not something you’d want to realize for the first time in the middle of a presentation about your latest design recommendations!)
- Generative workshop activities: If your goal is to generate a large amount of ideas or other contributions, use tools that make it easy to quickly add an item to a list or virtual whiteboard. Google Draw, Microsoft Visio, Sketch, MURAL, and Miro are a few examples that might work for this context.
- Evaluative workshop activities: If your goal is to group or prioritize ideas or contributions, consider platforms with built-in prioritization matrices such as MURAL or Miro. Alternatively, use survey tools such as SurveyMonkey or CrowdSignal, or live polling apps such as Poll Everywhere that you can insert directly into your slides.
Source: NN/g
When it comes to conducting user research, presenting UX work, or collaborating with other team members or stakeholders, we know that face-to-face interaction can have a lot of advantages: It’s easier for participants to build trust and rapport in person than remotely, and attendees are likely to pay attention and be cooperative for longer.
However, we can’t always conduct UX activities face to face. Sometimes, budget or time limitations, travel restrictions, or other unforeseen circumstances make in-person sessions impossible, unaffordable, or even unsafe. In these cases, remote sessions can offer immense value in maintaining the flow of insights and ideas.
Additionally, remote UX sessions offer many benefits that in-person sessions do not, regardless of the circumstances:
- Flexibility in project funds: Remote sessions lower travel expenses. This reduction might free up monetary resources for other valuable activities, such as recruiting additional research participants, doing extra rounds of research, or providing deeper analysis.
- Increased inclusiveness: Location and space are no longer limitations with remote sessions. For user research, this means access to a more diverse group of participants to whom you might not have access locally. For UX workshops and presentations, it means nonlocal colleagues can easily attend and more people in general can participate. (However, it doesn’t mean that everyone should attend. Continue to limit attendance to relevant roles.)
- Attendee convenience: Participants might be more willing and able to attend remote sessions that don’t require them to leave their office or home. They’ll save the commute time (whether that’s a couple of hours driving to a research facility or a few days traveling to a workshop in another city), and they can participate from the comfort of their own space. Especially with remote, unmoderated research or remote, asynchronous ideation, participants can complete tasks on their own schedule.
Given these advantages, remote UX work can be a useful solution to many project challenges. This article provides guidelines and resources for transitioning 3 types of common UX activities to the digital sphere:
- Conducting user research
- Facilitating and presenting
- Collaborating and brainstorming
Remote User Research
Generally, we recommend in-person usability testing and user interviews whenever possible. It’s simply easier to catch and read participant body language and recognize which breaks in dialogue are appropriate times to probe or ask followup questions. However, remote testing is preferable to no testing at all, and remote user research can accelerate insights on tight timelines and budgets.
Tips for Remote User Research
- Practice using the technology: Even if you are familiar with the tool you’ll be using, do a practice run with a colleague or friend. Particularly for remote, unmoderated sessions, make sure instructions for signing in and completing tasks are clear. Plan initial pilot testing with a few users so you can adjust technology and other factors as needed, before launching the study.
- Recruit additional users: With remote, unmoderated research, you can’t help if a handful of remote interviews or usability tests are rendered useless due to unsolvable surprise technology issues on the user’s end, such as firewalls. Recruit more users than you think you need in order to create a proactive safety net.
- Plan for technology challenges: Technology mishaps will occur. Assume technology challenges will happen, and don’t panic when they do. Have a backup plan ready, such as a phone dial-in in addition to a web link for user interviews and, whenever possible, use a platform that doesn’t require participants to download anything to join the session.
- Provide instructions: If the technology tool is complex or users will be setting it up and using it over an extended time, create documentation specific to the features you’ll ask them to use. For example, for our digital diary studies using shared Evernote notebooks, we provide detailed documentation for participants on how to set up and use the platform.
- Adjust consent forms: If you’ll be recording the participant’s face, voice, or screen while conducting a remote session, update your consent form to ask for explicit permission for each of these items. If you plan on asking additional researchers to join the session or if you’ll share recordings among the team during postsession analysis, outline and ask for consent on these items, as well.
Tools for Remote User Research
Consider tools that match the needs of your study, and, as always, match appropriate research methods to your study goals. Remote research is certainly better than no research at all; however, invalid insights are not helpful in any situation.
- Remote, unmoderated sessions: Tools such as Lookback, dscout, and Userbrain help capture qualitative insights from video recordings and think-aloud narration from users. Tools such as Koncept App and Maze capture quantitative metrics such as time spent and success rate. Many platforms have both qualitative and quantitative capabilities, such as UserZoom and UserTesting. (Be sure to check whether these tools work well with mobile applications, as needed.)
- Remote, moderated sessions: Any video conferencing platform that has screensharing, call recording and the ability to schedule meetings in advance is likely to meet the needs of most teams. Zoom, GoToMeeting, and Google Hangouts Meet are frequently used. (Remember to consider platforms that do not require participants to download anything to join the meeting.)
Source: NN/g

Journey maps are an artifact depicting the customer’s perspective of their experience engaging with an organization. Customer journey maps can act as a roadmap to identify opportunities and address both known and previously unknown customer pain points. Unfortunately, after the initial learning, journey maps often end up posted on a wall or filed away after achieving a checkmark for completing a required artifact.
What if journey maps evolve beyond a static snapshot of a customer’s experience?
What if a journey map is measurable, dynamic, and provides insight into customer experience over time?
Join us at the next HCD Community of Practice program as Noble Ackerson with iQIES shares recent work: Quantifying Behavior Along the Customer Journey.
The program will include:
- Shared Definitions
- Lean Analytics for Enterprise Health Products
- iQIES Key Takeaways
Register today to join the discussion and to collaborate with a community of professionals. Attend via WebEx.
A remote working structure can present difficulties for any team, in any field. For those in the UX field, it can be especially challenging. As we have recently transitioned (although temporary) to a complete remote working environment, we'd like to take some pointers from a company with a successful 100% remote structure, NN/g. Here are some specific challenges and recommendations which they've provided.
Challenges of Remote UX Work
Working remotely is a challenge for any team, but it can be especially difficult in the field of UX. NN/g has provided some specific challenges and recommendations, based on their successful 100%-remote structure.
Ideation and Collaboration
UX design often requires collaboration to generate ideas. In-person ideation workshops are much easier than the remote equivalent. When ideation participants are in the same room together, they have a shared context — it’s easy to see what they’re sketching on a sheet of paper and what sticky notes they’re posting on the walls. Also, when people can see each other face to face, the flow of information and emotion is easier to assess. If you’ve ever been on a conference call and rolled your eyes at a coworker, or awkwardly started talking at the same time as someone else, you’ll know the difference.
In a previous role at a different company, we had chronic problems with ineffective remote meetings — often, one or two people would dominate the conversation, while the rest would lurk without contributing.
A simple fix can avoid some of those issues: share webcam video as well as audio as much as possible. Just by being able to see the other people in the meeting, you’ll:
- Encourage empathy and bonding
- Be able to see when someone is about to speak
- Assess body language and expressions to better perceive your coworkers’ emotions
You’ll likely get more engagement from participants if they’re on video as well: it’s obvious when someone has mentally checked out of the meeting or is busy sending unrelated emails.
At NN/g we often use multiple tools to achieve a smooth remote ideation workshop. For example, we might share webcam feeds and audio using Zoom or GoToMeeting, while we share ideas visually using a collaborative product like Google Docs, Miro, or Mural.
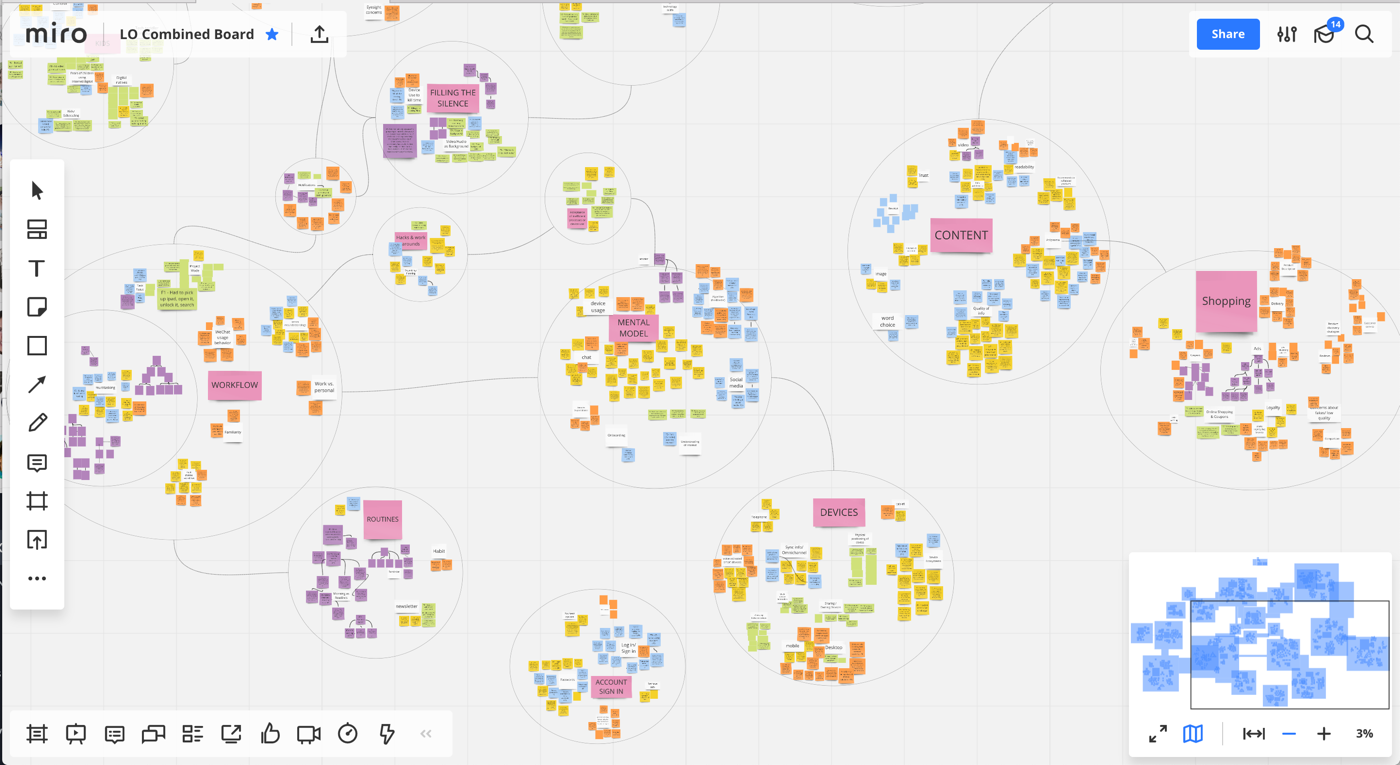
This screenshot shows the results of a remote affinity-diagramming exercise. In a video-conferencing meeting we used Miro, a whiteboard application, to cluster the findings from our Life Online research project and generate ideas for future articles and projects.
We tailor the tools to fit the needs of a particular meeting. For example, creating a journey map remotely may require different digital products than an ideation workshop.
Other remote teams have found success by using document cameras: each person in the meeting shares her video and audio streams, as well as her document camera that captures what she’s writing or drawing.
Team Building
When you don’t see your coworkers every day, it’s easy to slip into feeling disconnected from them.
We’ve found that having a company Slack workspace alleviates this feeling. In addition to having project- and topic-specific channels, we also have:
- #nng-pets: For sharing photos of our animal office mates
- #the-office-today: For sharing photos of where you happen to be working that day (a coffee shop, out on your deck, by a pool, etc.)
- #feedback: For requesting quick input on anything you’re currently working on (an idea, a graphic, or an excerpt of writing)
Source: NN/g
What is a Content Audit?
The word “audit” can strike fear into the most stoic of hearts. A Content Audit, however, is nothing to be feared. It is simply the process of taking an inventory of the content on your website. It is a large, detailed list of the information on your website and most often is in the form of a spreadsheet. This list will be the basis for the re-organization of your site.
There are three types of audits: Full, Partial and Sample. A Full audit is just as it sounds; a complete accounting of every page, file and media. A Partial audit’s parameters are less specific. However it will include every section of your site as well as a subset, which can be the top few levels of a hierarchical site or the last few months of articles written. A Sample audit is a compilation of example content.
Why Conduct a Content Audit?
We’ve all gone through our closets at some point in our lives to determine what we have, what we need, what we should keep and what we should throw away. We essentially performed an “audit” of our wardrobe and walked away with a newly reorganized closet, a feeling of accomplishment and a great excuse to go shopping. Auditing the content of the closet known as your website will provide you with a similar result for you and your users.
It allows you to know exactly what information you have on your site, what information you need on your site, what pages you need to keep and what pages are duplicative and can be “thrown away”. In addition it provides you with the information to address potential user pain points as well as opportunities for added value to your user. When you have completed your audit, you will now possess the information platform to create a newly streamlined and re-organized information architecture for your site, a better understanding of your content and great reason to get innovative in the solutions you provide your users.
How to Conduct a Content Audit?
There are different ways that you can audit the content of your website and there are different pieces of data that you can include.
The main recommended categories are:
- Navigation Title (main link to the content)
- Page Name
- URL (web address)
- Comments (any notes you’d like to remember)
- Content Hierarchy (how the content relates to each other).
Other suggested categories are:
- Content Type (page, blog post, media, attachment, article, etc.)
- Entry Points (how the user gets to that information)
- Last Date Updated
- Secure/Open (is the page open to all or secure?)
In order to conduct a successful Content Audit , use the following steps:
- Start with a blank spreadsheet. List your categories in the first row and your main pages or section in the first column
- Choose one page and list the information according to the categories
- If there are sub-pages, create a separate row for each under the main page/section and gather the same information for those as well
- Repeat these steps until every page is listed.
- Using this spreadsheet, analyze to determine where the opportunities and pain points are.
Key Tip #3 for UX success from Agile Practitioners
Soft skills can hold the keys to success in Agile projects. The respondents identified healthy collaboration as a main factor in success. This finding is not surprising; after all, in the Agile Manifesto, individuals and interactions are valued over processes and tools. Good communication is essential in any software-development organization, whatever its process methodology. However, collaboration is even more important in Agile settings, where delivery times are short and time-boxed.
Some organizations chose design-thinking techniques such as ideation and brainstorming to encourage discussion and tear down silos that often block effective communication and teamwork.
“Collaboration has been critical.”
“Close collaboration with other roles in the team has [helped us] arrive at agreements sooner in the process.”
“Constant ongoing collaboration with all team members. We use sketching and whiteboard sessions; journey-experience maps help capture the omnichannel experience.”
“Share info together in cross-functional teams. Communicate more with developer and designers.”
“No putdowns and no dismissal of ideas in early stages.”
“Involve everyone on the team and welcome everyone's suggestions and ideas.”
“Keep the relationship between the business analyst, designer, and engineer close.”
“Meet regularly once a week to update and know the progress. Focus on things to help one another accomplish the work.”
“Daily standups, iteration demos, biweekly pulse meetings, and interaction with management.”
In modern software-development environments, UX is heavily involved in defining how online products and services are developed. As such, the role of UX has expanded to include communication. UX can be the catalyst for good collaboration by involving team members in activities such as usability testing, and field studies, but also group design ideation and brainstorming.
Source: NN/g
What are Quality Metrics?
Quality Metrics are the measurement by which you can determine if you are meeting your goal of providing your users with useful and pleasant experience. These metrics demonstrate what your values and priorities are and ideally on what is essential to your user.
Why Use Quality Metrics?
In your effort to provide excellent user experience, you will implement changes to your product or service. The only way to determine if these changes are effective is by measuring the results. Quality metrics provide you with the platform to measure the results of your previous process with your improved process. After which you can determine if the changes moved you closer to your goal and what further improvements are necessary. Ultimately Pearson's Law applies: "That which is measured improves. That which is measured and reported improves exponentially."
How to Create Quality Metrics
Quality Metrics are established during the planning phase. Before you can improve a process, you have to outline what is “improvement.” This outline will serve as the basis from which you create your metrics. You can use your Feedback Loop to collect and analyze the information based on your metrics. It is vital that you establish metrics based on the following guidelines:
- Your metrics should be quantifiable: You are looking for results such as “85% of clients are satisfied” rather than “most clients are satisfied.”
- Your metrics should be actionable: Be sure to create actionable metrics, such as customer satisfaction or ease of use.
- Your metrics should be trackable over time: Construct your metrics in such a way that you can determine if the quality is improving.
- Your metrics should be maintained and updated regularly: Be sure to test your metrics consistently and to adjust them as your product or service changes.
- Your metrics are tied to your goals: Make sure your metrics focus on what is essential to your user and will drive the success of your product or service.